How to Measure Electric Dirt Bike Battery Health Without Guessing
A battery can read 100% on the display and still hold less energy than it did last year. It can sit at a perfectly normal resting voltage and then sag hard the moment you open the throttle. And it can give you a short ride simply because the route was muddier, the tires were softer or the morning was colder — nothing to do with the pack at all.
That is why a single reading never settles the question. A useful battery health test is a set of observations you can repeat, recorded well enough that a support technician could read your log and understand your ride without being there.
Everything below is non-invasive. Opening a pack, bypassing the BMS, modifying connectors or rigging an improvised high-current load test belongs with trained technicians using compatible equipment — not with an owner in a garage.
State of Charge Is Not State of Health
These two get confused constantly, and the confusion is the source of most bad battery diagnoses.
- State of charge (SOC) estimates how full the battery is right now. It is the fuel gauge.
- State of health (SOH) describes how the pack's present capability compares with a defined reference — usually its usable capacity when new. It is the size of the tank.
- A pack can sit at a confident 100% SOC and have a badly reduced SOH. The gauge is full; the tank is smaller.
Capacity-based SOH is expressed simply:
SOH (%) = measured usable energy ÷ reference usable energy × 100
The catch is the reference. Nominal voltage multiplied by rated amp-hours gives a specification-level estimate, not necessarily the energy the pack actually delivered when it was new. The strongest reference is an earlier measurement of the same pack, taken with the same measurement boundary under comparable conditions. If you have never recorded one, take a baseline today — it is worth more in a year than any specification number.
Stop Before Testing If You See Any of These
This screen comes first, before charging, before riding and before any measurement. Do not charge, ride or continue testing a battery that is:
- swollen, cracked, punctured or visibly deformed;
- unusually hot while simply resting;
- leaking, hissing, smoking or giving off a sharp chemical smell;
- wet inside, or damaged after a crash;
- connected through melted, discoloured or loose high-current terminals;
- repeatedly faulting during normal, approved charging.
|
Do not try to diagnose a pack that is failing in front of you. Move people away, follow local emergency guidance if there is smoke, fire or rapid heating, and contact the manufacturer or a qualified service provider. The U.S. Consumer Product Safety Commission and the U.S. Fire Administration both publish guidance for damaged lithium-ion batteries. |
Use only the charger approved for your battery and bike. Plug shape and nominal voltage do not make a charger compatible.
Test 1 — Document Charging Behaviour
Start with the cheapest evidence there is: writing down what happens when you plug in.
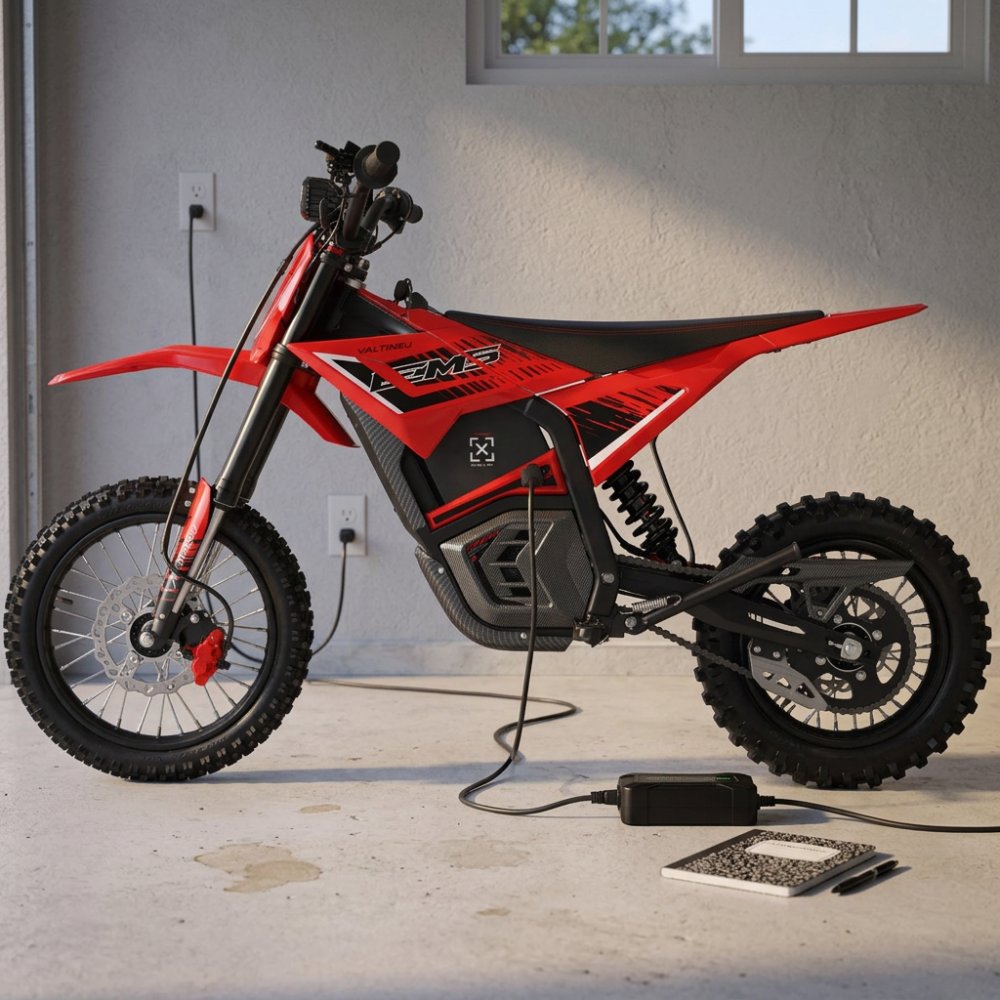
Record starting SOC, ambient and battery temperature, which charger you used and its rating, start and finish time, whether charging stopped normally, the final display SOC, and any fault light, smell, noise or unusual heat.
A change in charge time is a clue, not a diagnosis. A pack may charge faster because it holds less energy — or because it started at a higher SOC, because the room was warmer, because the BMS spent less time balancing, or because a different charger was used. One number, several possible causes.
If you have a plug-in AC energy meter, record the wall energy needed to return from a defined ending SOC to a defined starting SOC, and repeat it under similar conditions. That figure includes charger losses, so treat it as a trend line for your own system rather than as the pack's output capacity.
Test 2 — Check Resting Voltage Carefully
Use only externally accessible measurement points, and follow the manual. If the pack does not provide a safe, intended interface for this, skip the test — do not probe it.
|
Resting voltage CAN reveal |
Resting voltage CANNOT reveal |
|
A charger not bringing the system near its expected full-charge region |
How many watt-hours the pack will actually deliver |
|
A deeply discharged pack |
Whether individual cells are weak or unbalanced |
|
An obvious open circuit or connection fault |
How much the voltage will sag under real load |
An aged battery can reach a completely normal full voltage and still store noticeably less energy. Treat the reading as one line in a record, never as a verdict. Never short terminals with meter probes, and never remove the pack enclosure.
Test 3 — Measure Usable Energy
This is the strongest evidence available to an owner: energy delivered between two repeatable, manufacturer-approved operating points.
Option A — bike-integrated or approved inline meter
If the bike reports accumulated watt-hours, or a technician fits a correctly rated compatible meter, record battery-output energy across a controlled ride. Start and finish at the same defined SOC points every time you want to compare.
Option B — wall-to-battery recharge energy
Ride a fixed route to a defined end SOC, let the pack come back to a safe charging temperature, then measure the AC energy needed to recharge to the same starting condition. Fully non-invasive, and it includes charger losses.
Do not call wall energy "battery capacity." Call it a repeatable recharge-energy trend. It answers "is this changing?" honestly, and it answers "how big is the pack?" badly. The same distinction runs through ourWh-per-mile guide — keep the label attached to the number.
Test 4 — Run a Repeatable Range Check
Range only screens for change when the route is controlled. Use the same loop and direction, similar rider-plus-gear mass, the same riding mode and pace rule, the same tire pressures, similar temperature and trail condition, and the same start and end SOC. Record distance, elevation, moving speed and energy if available, and repeat at least twice.
Use a mapped loop and repeat it under comparable conditions. One short ride on a cold, muddy, climb-heavy day is not a battery diagnosis—it is a description of the weather.
|
What you observe |
What it points at |
|
Distance falls and Wh/mi rises |
Route, tires, brake drag, drivetrain or riding style — look here first |
|
Wh/mi stable but usable energy falls |
Capacity loss becomes the plausible explanation |
|
Both stable, range feels shorter |
Perception, or a change in where you stop — check the log, not the memory |
Test 5 — Observe Voltage Sag Under Normal Load
Voltage sag is the gap between resting voltage and voltage while the motor is drawing current. Some displays expose pack voltage; others need professional diagnostic equipment.
Compare like with like: similar SOC, similar battery temperature, the same hill or acceleration segment, the same riding mode, similar total mass. Excessive sag, early power reduction or a cutoff under a load the bike used to handle can indicate high internal resistance, weak cells or a poor connection — but it does not identify which one.
|
Do not brace the bike against an object and hold full throttle. A stationary high-current load test is dangerous to the rider, the drivetrain and everything nearby. Use a controlled riding check, or a professional test bench. |
Temperature Changes the Answer

Cold reduces the energy a lithium pack will deliver and raises its internal resistance, which deepens sag under load. TheU.S. Department of Energy documents the same effect for electric vehicles generally. A hot pack, meanwhile, may trigger protective limits that look like weakness but are the system doing its job.
A cold-morning test compared against a summer baseline will always flatter the summer. Record ambient temperature every time, record battery temperature if the system reports it, and never compare a January ride to a July one and call the difference degradation.
Calculating Capacity-Based SOH
If you have a valid battery-output energy measurement and a valid baseline:
|
SOH (%) = current measured usable Wh ÷ baseline measured usable Wh × 100 |
Worked through with illustrative numbers: a baseline of 1,500 Wh under the defined test, a current result of 1,260 Wh under comparable conditions, gives 1,260 ÷ 1,500 = 84% estimated capacity SOH.
This is arithmetic, not a certified measurement. Measurement error, temperature and slightly different end points all move the result, so publish the raw values and the conditions beside the percentage. And if all you have is nominal specification energy rather than a measured baseline, label the output an estimate — it is a useful direction, not a diagnosis.
Checking the Battery on a Used Bike
A short seller demonstration cannot establish capacity. It can, however, remove a lot of uncertainty if you ask for the right things:
- original purchase date and any battery replacement history;
- how the bike was stored, and at what state of charge;
- the original charger and the manual;
- service records, and a diagnostic printout if the model supports one;
- clear photographs of the pack and its connectors;
- a ride from a known SOC while you watch for sag, faults and abnormal heat.
A normal resting-voltage reading does not establish usable capacity or power delivery. When evaluating a used bike, treat an unverified battery as a material cost and service uncertainty, and seek model-specific replacement, warranty and diagnostic information before deciding.
EM-Series Battery Specifications and Documentation
Use the current Valtinsu electric dirt bike collection and the delivered manual to identify the pack, nominal voltage, capacity, charger and operating limits for the exact model. Product specifications can change; record the page date and do not reuse another model's charger or baseline.
|
Model |
Battery (published) |
What this does and does not tell you |
|
EM-5 |
48V / 23.4Ah |
A capacity class, not a measured usable-energy figure |
|
EM-5 Pro |
60V / 27Ah |
Higher voltage and capacity; still needs a measured baseline |
|
EM-5 Ultra |
72V / 25Ah Samsung |
Cell supplier named; usable energy still depends on conditions |
Use the model-specific approved charger and operating instructions. Do not infer charger compatibility from another EM-series model—three different nominal voltages sit inside one product family. Compare current battery specifications on the Valtinsu electric dirt bike collection, and use the maintenance guide to rule out non-battery causes of lost range.
Assign a Confidence Level Before You Call It Battery Health
High confidence: at least three comparable tests show the same direction in usable battery-output energy, route range or voltage sag, with temperature, endpoints and load documented.
Moderate confidence: repeated wall-recharge energy or controlled-route results change in the same direction, while tire pressure, brake drag, route, pace and temperature remain comparable.
Low confidence: the conclusion comes from one display percentage, one resting-voltage reading or one unusually short ride. Record it as a symptom and repeat the test; do not convert it into a state-of-health percentage.
Even a high-confidence owner trend is screening evidence, not a cell-level diagnosis. Capacity, resistance, self-discharge, charge acceptance and safety can degrade differently. When the pattern is mixed, sharp or accompanied by heat, odor, swelling, damage, corrosion or repeated faults, stop testing and send the complete log to qualified support.
Read the Pattern: Capacity Loss, Resistance Rise or External Load?
Battery health is not a failure mode. Owners usually see one of three patterns, and each points to a different next step.
Capacity-loss pattern
The bike still launches normally, voltage under a familiar load looks broadly similar, and Wh/mi on a controlled loop is stable—but the pack delivers fewer usable Wh between the same endpoints and the ride ends sooner. Repeat the test at a similar temperature before calling the trend degradation.
Resistance-or-connection pattern
Resting voltage looks normal, but sag is deeper on the same hill, power cuts back earlier, or the bike faults under load and then appears to recover. Cell resistance can rise with aging, but the same pattern can come from a connector, cable or BMS issue. It is a reason for qualified diagnosis, not permission to open the pack.
External-load pattern
If range falls while Wh/mi rises, increased consumption is a plausible alternative to lost capacity. Check temperature, tire pressure, brake drag, mud, elevation, speed and added mass, then repeat the route under comparable conditions before attributing the change to the battery.
NREL aging research shows why one signal is not enough: capacity fade and resistance growth can evolve differently, while several degradation mechanisms can produce overlapping symptoms. Owner-level tests can narrow the pattern; they cannot identify a cell-level cause.
The decision rule is simple: fewer usable Wh with stable consumption suggests capacity loss; deeper sag under the same load suggests a power-delivery problem; higher Wh/mi suggests the bike or route is consuming more. Mixed symptoms belong in a service report with the complete log, not in a confident garage diagnosis.
Editorial Verdict: Trend Beats a Single Battery Reading
The strongest owner-level battery-health evidence is not one voltage, one range result or one charge percentage. It is a repeatable trend: energy delivered between the same safe endpoints, on comparable loops, with temperature and configuration recorded. A single weak ride may reflect conditions; a repeated downward pattern under comparable conditions deserves investigation.
For a used-bike assessment, a pack that reaches 100% and shows a normal resting voltage has not established its usable capacity. Ask for charge history, fault records and repeatable energy or range evidence. If those records are unavailable, treat battery condition as an unresolved cost and service question. Stop using the pack and contact qualified support if there is swelling, impact damage, unusual heat, odor, corrosion or connector damage.
FAQs
How can you tell whether an electric dirt bike battery is healthy?
Use a pattern of repeatable evidence rather than one voltage or display reading. Compare charging behavior, resting voltage under controlled conditions, usable energy, repeatable route range, and voltage sag against the battery’s own earlier baseline.
Is battery percentage the same as battery health?
No. State of charge estimates how full the battery is now; state of health describes how capacity and internal resistance have changed over time. A battery can show 100% charge while storing less usable energy than it did when new.
Can resting voltage measure battery health?
Not by itself. Resting voltage is useful for detecting gross imbalance or an unusual state only when temperature, rest time, meter, and charge condition are controlled; it cannot prove capacity or internal resistance.
Why does the battery voltage drop under acceleration and recover afterward?
That behavior is voltage sag: current draw exposes internal resistance, and voltage partially recovers when the load falls. Compare sag only at similar state of charge, temperature, load, speed, and route; worsening repeatable sag can indicate resistance growth or a connection problem.
Does reduced winter range mean the battery is permanently damaged?
Not necessarily. Cold can temporarily reduce available energy and increase voltage sag; compare again at the manufacturer-approved normal temperature before declaring permanent degradation. Charging a battery outside its permitted temperature range can be unsafe.
When should battery testing stop and professional inspection begin?
Stop testing immediately and seek qualified support if any of the following is present:
- physical damage, swelling, leakage, hissing, smoke, unusual odor or abnormal heat;
- water ingress, corrosion, or a loose or discolored connector;
- repeated faults or a sharp, unexplained change in capacity or voltage sag;
- unknown measurement limits, charger compatibility, or service procedure.
For smoke, fire or rapid heating, move people away and follow local emergency guidance. Move the bike only when it can be done without increasing risk..
Sources
- U.S. CPSC — Micromobility Information Center
- U.S. Fire Administration — lithium-ion battery safety
- U.S. DOE — electric vehicles in cold weather
- U.S. DOE Alternative Fuels Data Center — electric vehicle basics
- Valtinsu editorial range-test protocol — publication pending
- Valtinsu — electric dirt bike lineup and EM-series specifications
- NREL — Lithium Loss, Resistance Growth and Failure Signals in Commercial Li-Ion Cells


Looking for something else?
Electric Dirt Bike Replacement Parts Availability: What Buyers Should Verify Before Ordering
LEARN MORE
How to Check an Electric Dirt Bike for Safety Recalls by Model and Serial Number
LEARN MORE
How to Choose an Electric Dirt Bike Repair Shop: Questions to Ask Before Service
LEARN MORE
How to Lift a Fallen Electric Dirt Bike Without Hurting Yourself or the Bike
LEARN MORELooking for something else?
Electric Dirt Bike Fall Riding on Wet Leaves: Grip, Hidden Obstacles and Braking
LEARN MORE
Electric Dirt Bike Trailside Power Loss: Recovery Plan When the Battery Is Dead
LEARN MORE